Reading your hours
Time summarises a date range with totals, a project activity chart and an entry table. Filter by client, project, phase, task or scope, then group the entries.
Read the summary and chart
The Time page reviews the hours you have already tracked. Its four cards, chart and entry table all use the date range and filters shown at the top.
- Total time shows the tracked duration and number of entries.
- Avg per day divides that time across the days that contain an entry. Days with no work are not included.
- Value at your rate values the time that has a resolved rate. A dash means there is no priced time in the range.
- Out of scope shows the duration you explicitly marked Out of scope. A dash means none is marked.
The comparison chips use the previous matching period. For example, a week compares with the week before it, and a custom range compares with the equally long range immediately before it.
When you worked plots the same filtered hours over the selected dates. Each colour represents a project.
Choose the range
Time starts on the current week. Change the period length, step backwards, or choose dates directly.


- Pick a length from the pill beside the arrows: Week, Month, Quarter, Year or Custom.
- Use the ‹ and › arrows to step one period at a time. The next arrow stops at the current period.
- Select the date label to open a calendar. Click a day to jump straight
to the period it falls in.
With Custom chosen, the calendar becomes a range picker: click a start day, then an end day, then press Apply.
- After moving away from the present, press the small ✕ labelled Back to this week, or the equivalent label for the chosen unit, to return to the current period.
Filter and group entries
Filter entries narrows the whole page. The cards, chart and table all update together. Group by changes only the layout of the entry table.
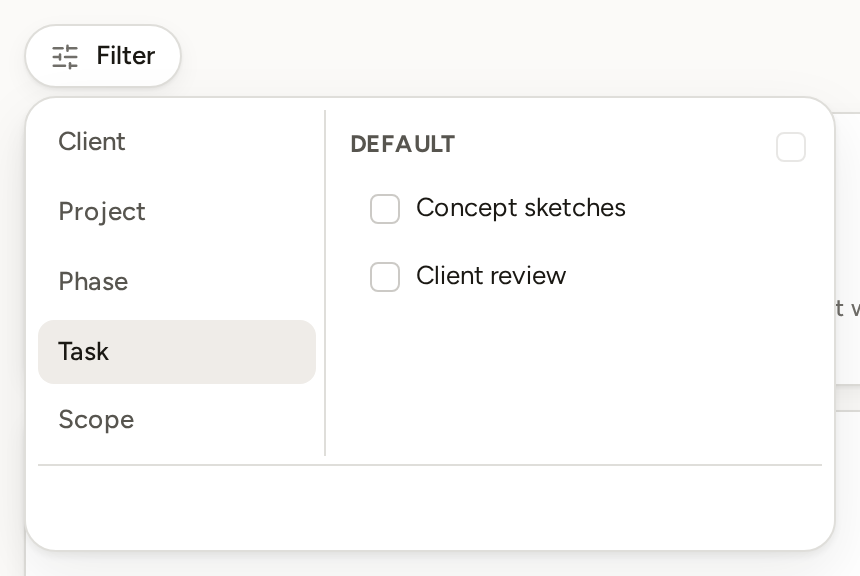
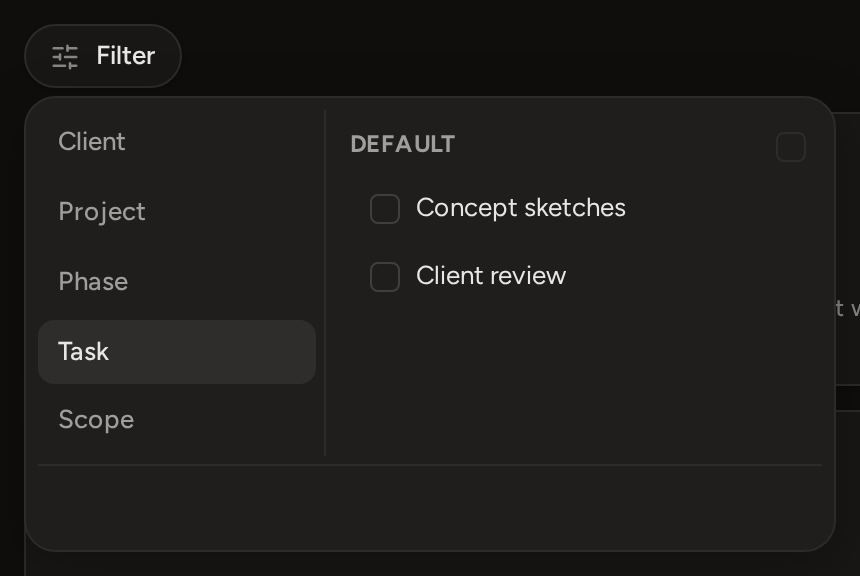
- The filter offers Client, Project, Phase and Task. Each choice comes from work you have tracked, including archived records that still carry time.
- A task name appears once under its task group. Selecting it includes every tracked task with that name across the selected projects.
- Once any tracked entry is marked Out of scope, a Scope filter appears with Original and Out of scope choices.
- Open Group by in the Entries card.
- Choose Day, Project, Client or Phase.
Each section gets a time subtotal. A value subtotal also appears when the filtered work has a rate.
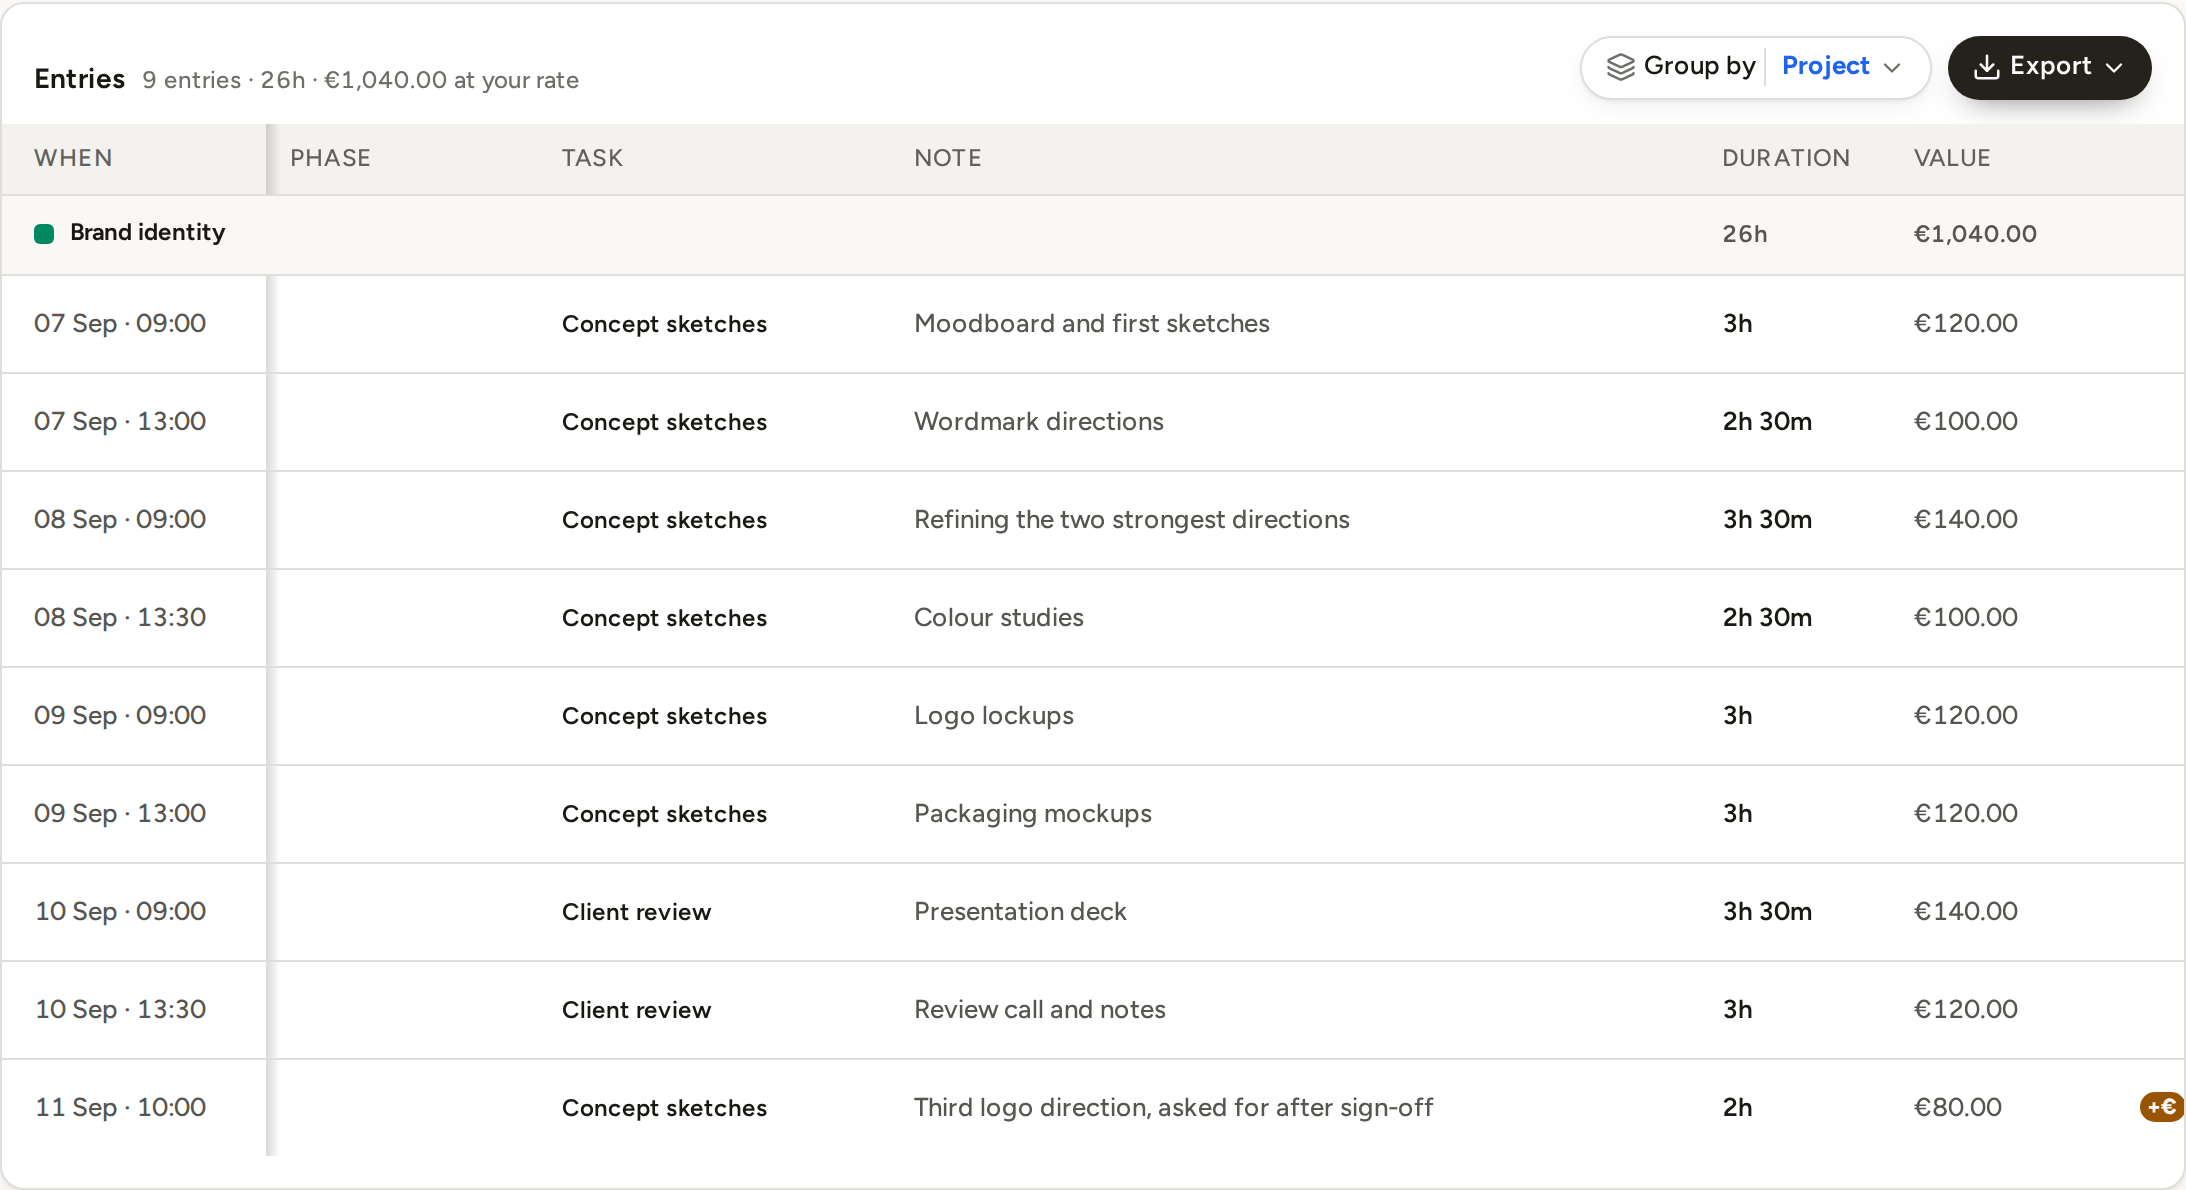
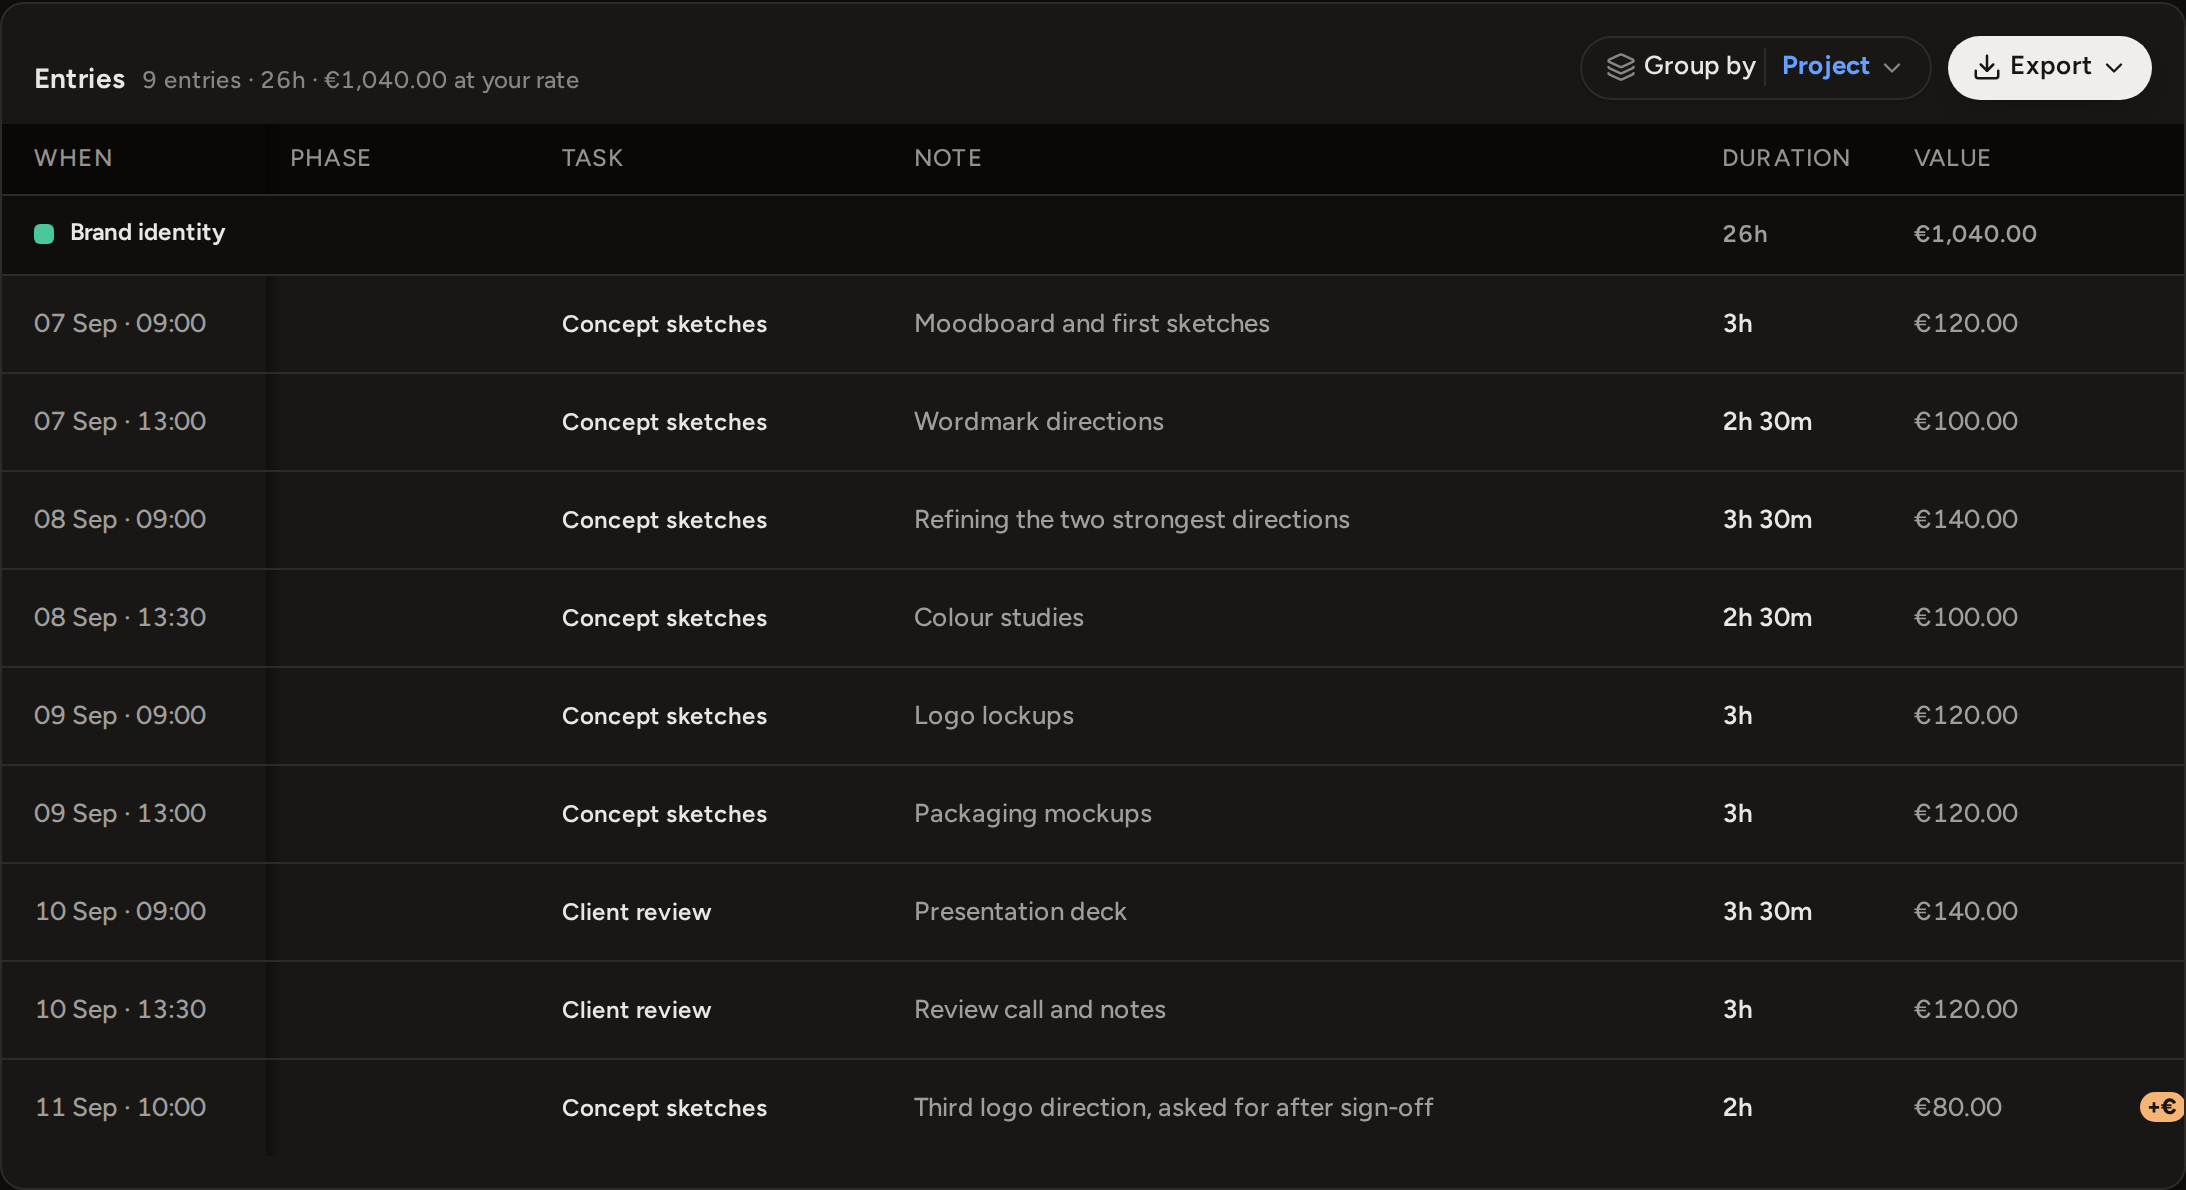
When grouped by Project or Phase, that column leaves the table because the group heading already names it.